
Using Nt Charts
How to draw line, area, scatter, bar and pie charts, and show them in a widget.
Nt Charts draws charts for dashboards and reports in applications made with Nt Widgets. It has the API of Qt Charts: a QChart holds series, axes, a legend and a title, and a QChartView shows it.
find_package(Nt6 REQUIRED)
add_executable(dashboard main.cpp)
target_link_libraries(dashboard PRIVATE Nt::Charts)
A First Chart
Make a series, add it to a chart, give the chart axes, and show it in a view:
auto *series = new QLineSeries;
series->setName("CPU");
for (int t = 0; t < 60; ++t)
    series->append(t, sample(t));

auto *chart = new QChart;
chart->setTitle("Load");
chart->addSeries(series);
chart->createDefaultAxes();
chart->axes(Qt::Vertical).first()->setRange(0, 100);
auto *view = new QChartView(lineChart(&live));
view->setRubberBand(QChartView::HorizontalRubberBand);
grid->addWidget(view, 0, 0);
The chart owns its series and axes, and the view owns the chart. createDefaultAxes() makes a pair of axes that fit the data of all series. For more control, make the axes yourself, add them with QChart::addAxis() and attach them to the series with QAbstractSeries::attachAxis():
auto *done = new QBarSet("Done");
*done << 12 << 18 << 9 << 15;
auto *open = new QBarSet("Open");
*open << 4 << 6 << 3 << 8;

auto *series = new QBarSeries;
series->append(done);
series->append(open);
series->setLabelsVisible(true);
QObject::connect(series, &QBarSeries::clicked, [](int index, QBarSet *set) {
    std::printf("%s: %g\n", set->label().toUtf8().constData(), set->at(index));
});

auto *axisX = new QBarCategoryAxis;
axisX->append({"Core", "GUI", "Network", "Charts"});
auto *axisY = new QValueAxis;
axisY->setRange(0, 20);

auto *chart = new QChart;
chart->setTitle("Tickets");
chart->addSeries(series);
chart->addAxis(axisX, Qt::AlignBottom);
chart->addAxis(axisY, Qt::AlignLeft);
series->attachAxis(axisX);
series->attachAxis(axisY);
The Kinds of Charts
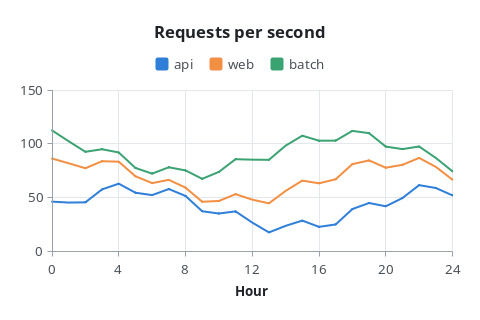
QLineSeries joins its points with straight lines.
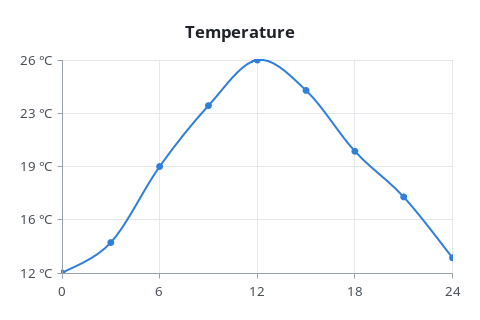
QSplineSeries draws a smooth curve through its points.
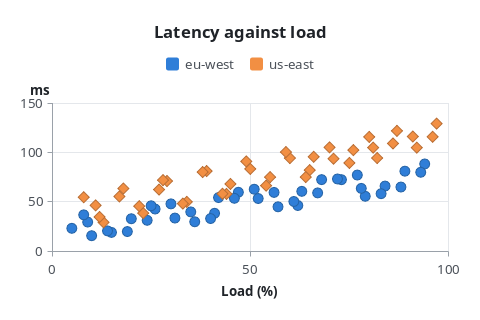
QScatterSeries draws a marker at each point.
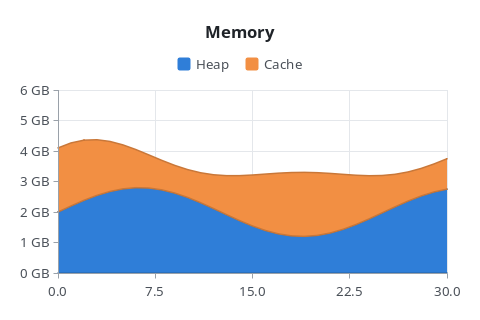
QAreaSeries fills between two lines, or below one.
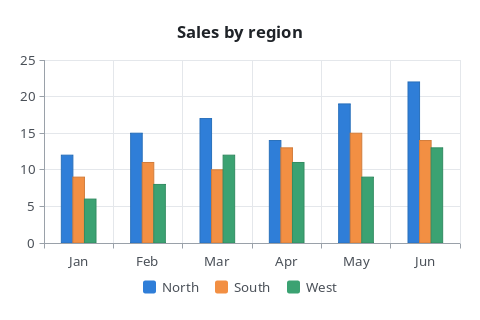
QBarSeries draws the values of each QBarSet side by side.
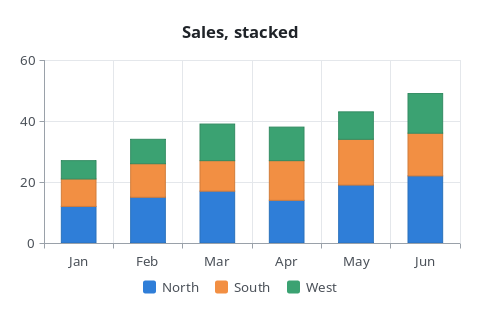
QStackedBarSeries stacks them.
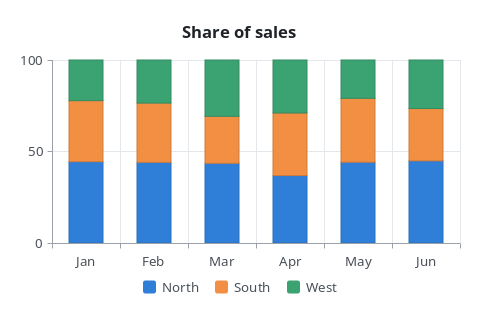
QPercentBarSeries shows each set's share of a category.
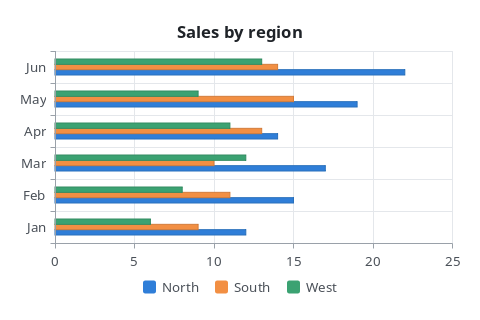
QHorizontalBarSeries, QHorizontalStackedBarSeries and QHorizontalPercentBarSeries lay the bars down.
QPieSeries draws its slices as a pie.
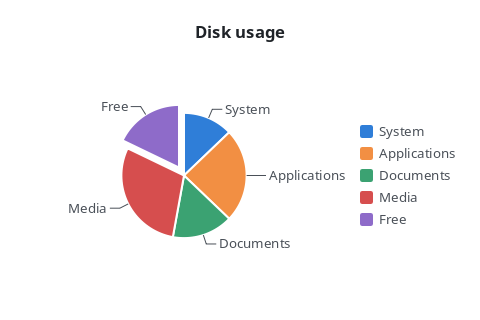
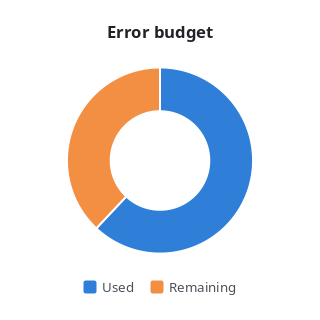
With a hole, a pie series is a donut.
Axes
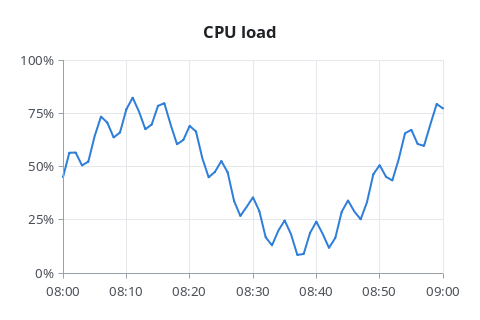
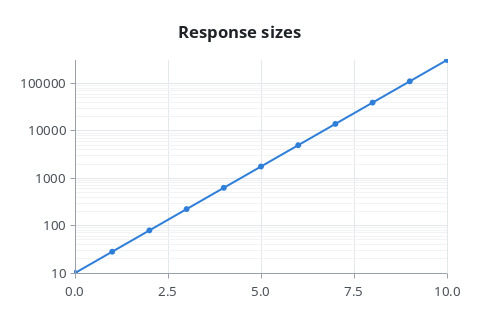
QValueAxis maps real numbers, QLogValueAxis a logarithmic scale, QDateTimeAxis dates and times given in milliseconds since the epoch, and QBarCategoryAxis named categories. An axis whose range was not set takes the extent of the data of its series when they are attached; set the range yourself for data that changes.
Live Data
For data that keeps arriving, replace all points of a series at once with QXYSeries::replace(), and move the axis along with it:
QList<QPointF> points = series->points();
points.removeFirst();
points.append(QPointF(t, sample));
series->replace(points);
chart->axes(Qt::Horizontal).first()->setRange(t - 59, t);
The view draws the chart again after each change, once per frame at most.
Themes
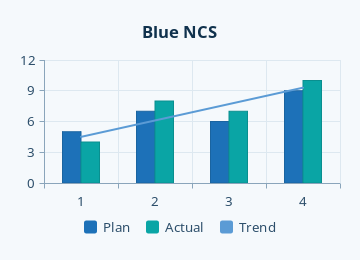
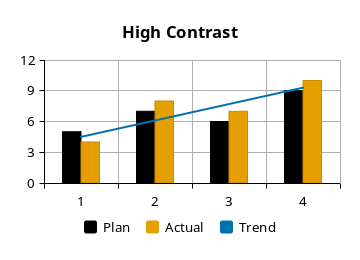
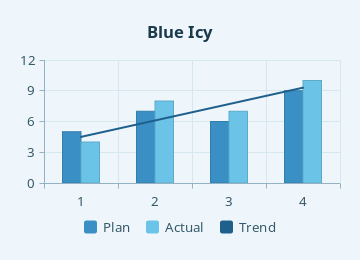
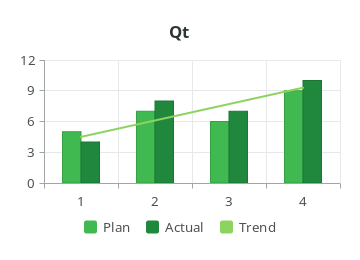
QChart::setTheme() sets the colors of the whole chart. Colors set on the chart, its series and axes win over the theme until it is changed again.
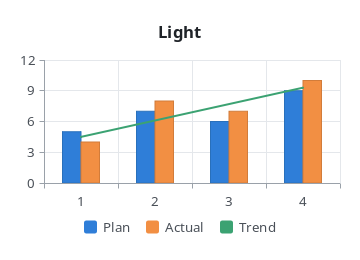
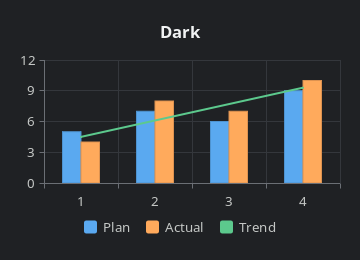
QChart::ChartThemeBlueCerulean:
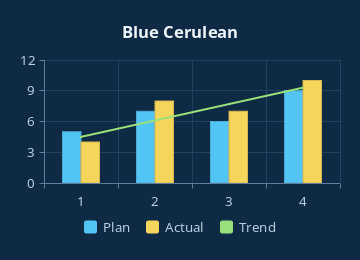
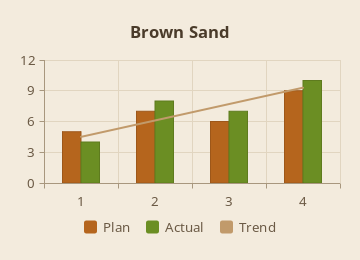
QChart::ChartThemeHighContrast:
The Mouse
Series emit signals when they are clicked or hovered: QBarSet::clicked(), QPieSlice::hovered(), QXYSeries::clicked() and so on.
auto *series = new QPieSeries;
series->setHoleSize(0.4);
series->append("Passed", 182);
series->append("Skipped", 11);
QPieSlice *failed = series->append("Failed", 7);
failed->setExploded(true);
failed->setLabelVisible(true);
QObject::connect(series, &QPieSeries::hovered, [](QPieSlice *slice, bool state) { slice->setExploded(state); });

auto *chart = new QChart;
chart->setTitle("Tests");
chart->addSeries(series);
chart->legend()->setAlignment(Qt::AlignRight);
With QChartView::setRubberBand(), dragging over the plot area zooms into it, and a right click zooms out. QChart::zoomIn(), QChart::zoom(), QChart::scroll() and QChart::zoomReset() do the same from code.
Without a View
QChart::paint() draws a chart on any painter, so a chart can be written to an image or printed:
chart->resize(QSizeF(640, 400));
QImage image(640, 400, QImage::Format_ARGB32_Premultiplied);
image.fill(Qt::white);
QPainter painter(&image);
chart->paint(&painter);
painter.end();
image.save(argv[2]);
The chart_dashboard example shows four charts that update live. The pictures on this page are drawn by render_charts; cmake --build build --target chart_images draws them again.
Differences from Qt Charts
QChart is a QObject and QChartView a QWidget: there is no graphics scene, so charts cannot be transformed or mixed with other graphics items. There are no animations, polar charts, box plots, candlesticks, category axes with ranges, color axes, model mappers or QLegendMarker objects. Labels are drawn upright. Each class lists its own differences.