
QChart Class
The QChart class holds the series, axes, legend and title of a chart, and draws them. More…
| Header | #include <QChart> |
|---|---|
| CMake | target_link_libraries(app PRIVATE Nt::Charts) |
| Module | Nt Charts C++ Classes |
| Inherits | QObject |
List of all members, including inherited members
Public Types
| enum | ChartTheme |
| enum | AnimationOption |
| typedef | AnimationOptions |
| enum | ChartType |
Public Functions
Signals
| void | plotAreaChanged(const QRectF &plotArea) |
Detailed Description
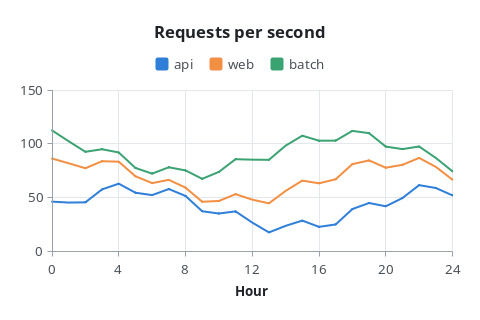
Add series to a chart, give them axes, and show the chart in a QChartView:
auto *series = new QLineSeries;
series->setName("CPU");
for (int t = 0; t < 60; ++t)
    series->append(t, sample(t));

auto *chart = new QChart;
chart->setTitle("Load");
chart->addSeries(series);
chart->createDefaultAxes();
chart->axes(Qt::Vertical).first()->setRange(0, 100);
The chart owns its series and axes. A series without axes is drawn against a scale that fits its data; createDefaultAxes() makes a pair of axes that fit all series, and addAxis() with QAbstractSeries::attachAxis() gives finer control: several axes on one side, or a second scale on the right.
The look comes from the theme(): background, text, grid and series colors. The themes are pictured in Using Nt Charts. Colors set on the chart, its series or its axes win over the theme until setTheme() is called again.
Zooming changes the ranges of the axes: zoomIn() to a rectangle of the plot area, zoom() by a factor, scroll() by pixels, and zoomReset() to go back. QChartView zooms with a rubber band.
See also QChartView, QAbstractSeries, QAbstractAxis, QLegend and Using Nt Charts.
Differences from Qt
The chart is a QObject, not a QGraphicsWidget, and is drawn by QChartView or by paint() on any painter. There are no animations: animationOptions() is kept but has no effect. There is no drop shadow, no polar chart (QPolarChart), no localized numbers and no QChart::locale(). setGeometry(), resize() and paint() are the parts of the QGraphicsWidget API that Nt keeps.
Member Type Documentation
enum QChart::AnimationOption
Which changes are animated. Nt draws every change at once.
| Constant | Description |
|---|---|
QChart::NoAnimation | No animations. |
QChart::GridAxisAnimations | Changes of the axes. |
QChart::SeriesAnimations | Changes of the series. |
QChart::AllAnimations | Both. |
typedef QChart::AnimationOptions
A QFlags of AnimationOption values.
enum QChart::ChartTheme
The themes of a chart. Each sets the colors of the background, text, axes and grid, and a palette for the series.
| Constant | Description |
|---|---|
QChart::ChartThemeLight | Light background, the default. |
QChart::ChartThemeBlueCerulean | Deep blue background. |
QChart::ChartThemeDark | Dark background. |
QChart::ChartThemeBrownSand | Sand background with earthy series. |
QChart::ChartThemeBlueNcs | Light background with shades of blue. |
QChart::ChartThemeHighContrast | White background, black text and strongly contrasting series. |
QChart::ChartThemeBlueIcy | Pale blue background. |
QChart::ChartThemeQt | Light background with green series. |
enum QChart::ChartType
The kind of chart.
| Constant | Description |
|---|---|
QChart::ChartTypeUndefined | Not known. |
QChart::ChartTypeCartesian | A chart with horizontal and vertical axes, as QChart is. |
QChart::ChartTypePolar | A polar chart; Nt has none. |
Member Function Documentation
QChart::QChart(QObject *parent = nullptr)
Constructs an empty chart with the given parent, 400 by 300 pixels.
QChart::~QChart()
Destroys the chart, its series and its axes.
void QChart::addAxis(QAbstractAxis *axis, Qt::Alignment alignment)
Adds axis to the chart, on the side of the plot area given by alignment: Qt::AlignLeft, Qt::AlignRight, Qt::AlignTop or Qt::AlignBottom. The chart takes ownership of it. Axes on the same side are drawn side by side.
See also QAbstractSeries::attachAxis().
void QChart::addSeries(QAbstractSeries *series)
Adds series to the chart, which takes ownership of it. A series can be in one chart only.
See also removeSeries() and createDefaultAxes().
int QChart::animationDuration() const
Returns the duration of animations in milliseconds.
AnimationOptions QChart::animationOptions() const
Returns the animation options.
QList<QAbstractAxis *> QChart::axes(Qt::Orientations orientation = Qt::Horizontal | Qt::Vertical, QAbstractSeries *series = nullptr) const
Returns the axes of the chart with the given orientation. If series is not nullptr, returns only the axes attached to it.
QBrush QChart::backgroundBrush() const
Returns the brush of the background of the chart.
QPen QChart::backgroundPen() const
Returns the pen of the border of the chart. Unless one was set, there is no border.
qreal QChart::backgroundRoundness() const
Returns the diameter of the rounded corners of the background. The default is 0.
ChartType QChart::chartType() const
Returns ChartTypeCartesian.
void QChart::createDefaultAxes()
Removes and deletes the axes of the chart, and makes a horizontal and a vertical axis that fit the data of all series, attached to all of them: QBarCategoryAxis for the categories of bar series and QValueAxis otherwise. Pie series get no axes. Add the series first.
QRectF QChart::geometry() const
Returns the geometry of the chart.
bool QChart::isBackgroundVisible() const
Returns true if the background is drawn; otherwise returns false.
bool QChart::isDropShadowEnabled() const
Returns true if a drop shadow was asked for; otherwise returns false.
bool QChart::isPlotAreaBackgroundVisible() const
Returns true if the background of the plot area is drawn; otherwise returns false.
bool QChart::isZoomed()
Returns true if the chart was zoomed or scrolled since it was created or zoomReset() was called; otherwise returns false.
QLegend * QChart::legend() const
Returns the legend of the chart. The chart owns it.
QPointF QChart::mapToPosition(const QPointF &value, QAbstractSeries *series = nullptr)
Returns where value of series is drawn, in the coordinates of the chart. Without a series, the first series of the chart is used.
See also mapToValue().
QPointF QChart::mapToValue(const QPointF &position, QAbstractSeries *series = nullptr)
Returns the value of series at position, in the coordinates of the chart. Without a series, the first series of the chart is used.
See also mapToPosition().
QMargins QChart::margins() const
Returns the room between the edges of the chart and its contents. The default is 20 pixels on each side.
void QChart::paint(QPainter *painter)
Draws the chart with painter, at its geometry(). This draws a chart on an image or a printer without a view:
chart->resize(QSizeF(640, 400));
QImage image(640, 400, QImage::Format_ARGB32_Premultiplied);
image.fill(Qt::white);
QPainter painter(&image);
chart->paint(&painter);
painter.end();
image.save(argv[2]);
QRectF QChart::plotArea() const
Returns the rectangle in which the series are drawn, in the coordinates of the chart.
QBrush QChart::plotAreaBackgroundBrush() const
Returns the brush of the background of the plot area.
QPen QChart::plotAreaBackgroundPen() const
Returns the pen of the border of the plot area.
void QChart::plotAreaChanged(const QRectF &plotArea)
This signal is emitted when the plot area of the chart changes to plotArea, for example because the chart was resized or a title was added.
void QChart::removeAllSeries()
Removes and deletes all series.
void QChart::removeAxis(QAbstractAxis *axis)
Removes axis from the chart without deleting it, and detaches it from its series.
void QChart::removeSeries(QAbstractSeries *series)
Removes series from the chart without deleting it; the caller owns it again. Its axes are detached.
void QChart::resize(const QSizeF &size)
Sets the size of the chart to size, keeping its position.
void QChart::scroll(qreal dx, qreal dy)
Scrolls the plot area by dx pixels to the right and dy pixels up: the axes show larger values.
QList<QAbstractSeries *> QChart::series() const
Returns the series of the chart.
void QChart::setAnimationDuration(int msecs)
Sets the duration of animations to msecs milliseconds. Nt keeps the value.
void QChart::setAnimationOptions(AnimationOptions options)
Sets the animation options to options. Nt keeps them and animates nothing.
void QChart::setBackgroundBrush(const QBrush &brush)
Sets the brush of the background of the chart to brush.
void QChart::setBackgroundPen(const QPen &pen)
Sets the pen of the border of the chart to pen.
void QChart::setBackgroundRoundness(qreal diameter)
Rounds the corners of the background with circles of the given diameter.
void QChart::setBackgroundVisible(bool visible = true)
Draws the background of the chart if visible is true. Without it, what is under the chart shows through.
void QChart::setDropShadowEnabled(bool enabled = true)
Sets whether the background casts a shadow to enabled. Nt keeps the value and draws no shadow.
void QChart::setGeometry(const QRectF &rect)
Sets the geometry of the chart to rect: where paint() draws it. QChartView makes it fill the view.
void QChart::setMargins(const QMargins &margins)
Sets the room between the edges of the chart and its contents to margins.
void QChart::setPlotArea(const QRectF &rect)
Fixes the plot area to rect, in the coordinates of the chart. An empty rectangle lets the chart lay it out again.
void QChart::setPlotAreaBackgroundBrush(const QBrush &brush)
Sets the brush of the background of the plot area to brush.
See also setPlotAreaBackgroundVisible().
void QChart::setPlotAreaBackgroundPen(const QPen &pen)
Sets the pen of the border of the plot area to pen.
void QChart::setPlotAreaBackgroundVisible(bool visible = true)
Draws the background of the plot area if visible is true. It is off by default.
void QChart::setTheme(QChart::ChartTheme theme)
Sets the theme of the chart to theme. The colors and fonts that were set on the chart, its legend, series and axes are forgotten, so that the whole chart follows the theme.
void QChart::setTitle(const QString &title)
Sets the title, drawn above the plot area, to title.
void QChart::setTitleBrush(const QBrush &brush)
Sets the brush of the title to brush.
void QChart::setTitleFont(const QFont &font)
Sets the font of the title to font.
QSizeF QChart::size() const
Returns the size of the chart.
QChart::ChartTheme QChart::theme() const
Returns the theme of the chart. The default is ChartThemeLight.
QString QChart::title() const
Returns the title.
QBrush QChart::titleBrush() const
Returns the brush of the title.
QFont QChart::titleFont() const
Returns the font of the title: unless one was set, the default font, bold and a quarter larger.
void QChart::update()
Asks the view that shows the chart to draw it again. Changes to the chart, its series and axes call it.
void QChart::zoom(qreal factor)
Zooms by factor around the center of the plot area: in if it is larger than 1, out if it is smaller.
void QChart::zoomIn()
Zooms in by a factor of 2, around the center of the plot area.
void QChart::zoomIn(const QRectF &rect)
This is an overloaded function.
Zooms in so that rect, in the coordinates of the chart, fills the plot area.
void QChart::zoomOut()
Zooms out by a factor of 2, around the center of the plot area.
void QChart::zoomReset()
Gives the axes the ranges they had before the first zoom or scroll.